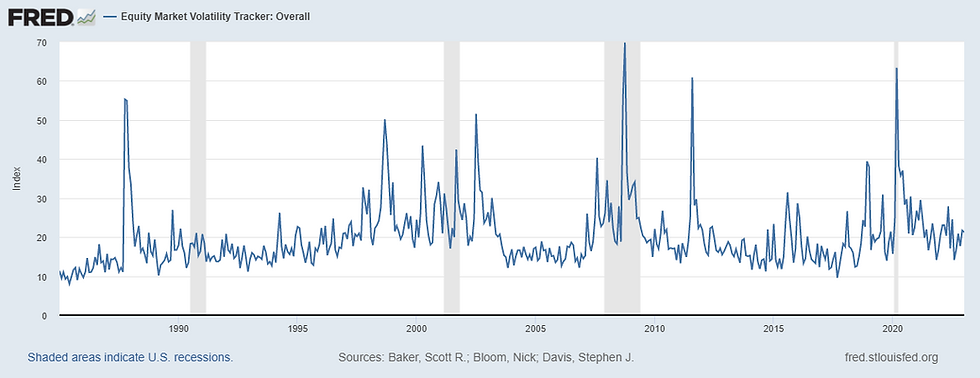
Q4 finally saw a bit of a bounce in risk assets, with US stock markets gaining more than 14% in the S&P 500 from the bottom in October to the top in November. That took volatility pricing to its lowest levels of the year, printing down into the teens at 19.06 on December 2nd.
If that was the story for the year, investors in stocks and bonds may not have been too worried, but that was just the bounce. We sold off again in December to bring the S&P 500 to -18.17%, its worst year since the Great Financial Crisis in 2008 and fourth worst in the last 70 years.
Volatility, meanwhile, continued its complicated relationship with equity prices in the fourth quarter. While a -5% sell-off may have sent the VIX 10 to 20 points higher in 2017 or 2020, the December S&P loss of more than -5% saw volatility close just a single point higher.

Our friends at RCM have some great content and conversation regarding the VIX and Volatility on their YouTube channel: VIX & Volatility - YouTube
For the year, the VIX rose just 3.5 points, from 17.2 to 21.7 in the seventh worst year for stocks since 1920, worst year ever for the AGG bond index, and worst year since the Great Depression for the 60/40 portfolio (per awealthofcommonsense blog).

We are likely to see a more normalized volatility environment in 2023. While frustrating in December, the lack of a spike in volatility that month makes it cheaper to hold in January. Each slight normalization like that, whether due to a rally or due to investors having a good sense of the market’s downside given the Fed, helps bring down the expense of volatility hedges and allows for potentially greater upside protection.
Comments